The Bankers is a brilliant book, written by Martin Mayer, about monetary policy and the interplay between policy and its real-world effect. In that book, Mayer explores inflation and how central bankers have tried to tame or stimulate it through time. Setting the discussion for inflation Mayer describes the impact that inflation has on a society thusly.
“Archaeologists can measure the strength and quality of an ancient government by weighting the quantity of precious metals in its coinage: strong governments maintained the gold content of their coins, weak governments “clipped” the coinage, putting less gold or silver into coins of the same face value. Similarly, weak governments today run deficits and print money to pay their bills, inflating the currency and indirectly taxing not only their citizens’ store of wealth but also their workers’ salaries, which buy less every week.”
Mayer goes on to write:
“During the 1970s, we worried about a condition called “stagflation,” when prices rose without stimulating employment. But it was the pressure of that continuing inflation that created the conditions for the restoration of economic growth. In the 1970s, everybody knew that money would be worth less tomorrow than it was today, so people had reason to borrow it and spend it, the “automatic stabilizers” of the federal budget set a floor
under declining consumption, and eventually productive facilities were fully employed again. As Hyman Minsky points out, government deficits increase private profits.”
We are witnessing a replay of past experiences today. Nothing plays out the same, but the similarities are striking. Deficits in the past two years were the highest we’ve seen, central bankers, have printed unimaginable amounts of money, effectively “clipping coinage”. An indication of financial strength, or lack thereof. As in the 1970s, prices are rising today and it’s hard to see how employment will grow further as indications are that we are at full employment. What’s very different between now and the 70s is the capacity that governments and people had to borrow to spend more.
What came after the 1970s left an indelible mark on the memories of those who had to pay debts and mortgages in the 80s.
Canada:
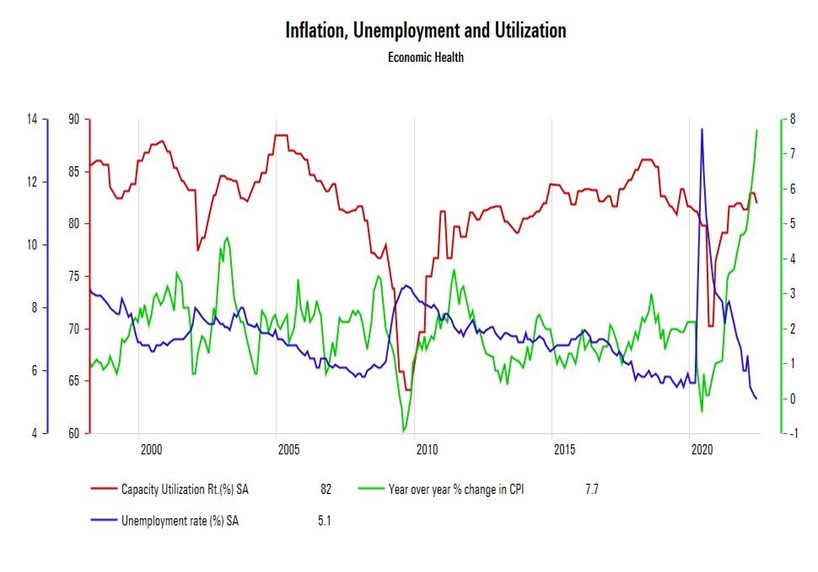
GIC (Guaranteed Investment Certificate) Investors would seem to be happier with the Bank of Canada’s past two rate hikes – the likes we haven’t seen in decades – of 75bps and 100bps. The latter not having been seen since 1998 (24 years). GIC investors would only seem to be happier because whatever gains they’ve made in these rates have been eroded by Inflation increasing to 7.7%.
Unemployment too has seen a massive change in the past two years. The pandemic caused double digit unemployment stemming from lockdowns and business closures. However, many businesses are finding it hard to find staff to keep up with demand. Canada has seen one of the lowest unemployment rates since data became available in 1976. Arguably, Canada has seen lower unemployment numbers coming out of WWII and into the 50s, however, that comparison is tenuous at best because the public safety net was vastly different.
What’s curious is the continued policies of the governments to pursue expensive greening policies. Policies that forgo focusing on achieving larger security and supply of energy from our existing oil and natural gas reserves. This would have an impact on lowering the burden of higher prices we all face – oil and gas prices underpin much of the increase in inflation as those commodities, and their constituents, are pervasive in much of what we buy. It is reasonable to expect that Russia may cut-off supply of energy to Europe over the coming winter to leverage its position on Ukraine and impose pain on countries seeking to aid the embattled nation. It’s not out of the question to suggest that energy prices will continue to remain high and perhaps hit new highs.
US:
As Q2 came to a close, on June 29th the Bureau of Economic Analysis (BEA) released its third estimate of Q1 GDP, revising it lower from negative 1.4% to negative 1.6% (adjusted for inflation). The third estimate is the final Q1 reading and based on more complete source data than the first and second estimates. The fact that it was revised lower was not encouraging. And a negative reading for Q2 would lead most to declare the economy is officially in contraction, i.e., a recession has arrived.
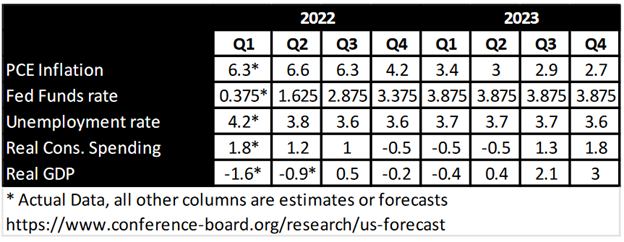
On July 12th the Conference Board (CB) Forecast for the US Economy was released, wherein growth expectations were downgraded from positive 1.9% to 0.8%, still holding out hope that the second consecutive quarter of negative real GDP growth would be avoided. This hope was dashed on July 28th when the BEA released its advance estimate for Q2 real GDP with a reading of negative 0.9%.
The primary drivers of economic weakness are seen as high inflation and rapid monetary tightening. Geopolitical conflict and persistent supply chain disruptions from COVID-19 continue to push prices higher. However, “some progress has been made on these factors recently”, and inflation is seen to have peaked in Q2 2022. But it will remain well above the Fed’s target of 2% for the remainder of 2022 and throughout 2023.
Unemployment is historically low and is expected to remain so through the end of 2023. Consumer spending is seen to be moderately strong in 2022 but weaken in 2023. As shown here, slowing consumer spending, brought on by continuing Fed rate hikes meant to tame inflation, will cause economic contraction to continue through the first half of 2023.
Historical Reference
Although history never repeats, it might rhyme a bit. Over the past century, two periods show persistent, high inflation over 5% like the one we seem to have entered – the 1940’s and the 1970’s-to-early-1980’s.

Of the two previous periods, the 1940’s seems to rhyme better than the 70’s and early 80’s when comparing the fundamentals of government deficits, short-term T-bill rates, and unemployment.
Government Deficits
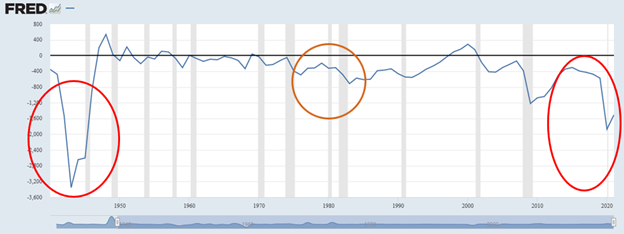
In the 1940’s, government deficits expanded rapidly to fund World War II, as they have in the 2020’s to fund the COVID-19 pandemic. This did not occur to nearly as great an extent in the 1970-80’s inflationary period.
Short-term Tbill rates
Accordingly, in the 1940’s the Fed was hesitant to raise rates rapidly on the back of ballooning government debt. Despite high inflation, 3-month Tbill rates averaged less than 1% throughout the decade. Today the Fed seems more intent on taming inflation, and as a result 3-month Tbill rates have climbed to over 2.5%. Nevertheless, this is nothing like the 1970’s. With government debt at a lower level the Fed had more flexibility, and seeing a need to quash inflation quickly, raised rates rapidly. 3-month Tbill rates shot up from around 5% to over 15%!
Unemployment
In the 1940’s, as the US entered the War, unemployment shot up to the mid-teens. Subsequently, with the expansion of Fed money-printing and government deficits, unemployment came down and was near 2% by 1945. Of course, as the troops returned home and to the workplace, it rose again, but remained within a range between 3% and 7%. In the 2020’s, we have seen a similar pattern thus far with unemployment shooting higher with the onset of the pandemic, but rapidly declining as government deficit spending found its way into the economy. Conversely, in the 1970’s unemployment climbed steadily from around 5% in 1975 to over 10% by the end of the decade.
In 2022, we have entered an inflationary period that may well become an inflationary era. Given that the fundamental elements mentioned above compare more distinctly to the 1940’s inflationary era, it might be useful to gain perspective by taking a look at market dynamics of the 1940’s. Although not intended as a script for market timing, it might offer some useful insights.
1940’s
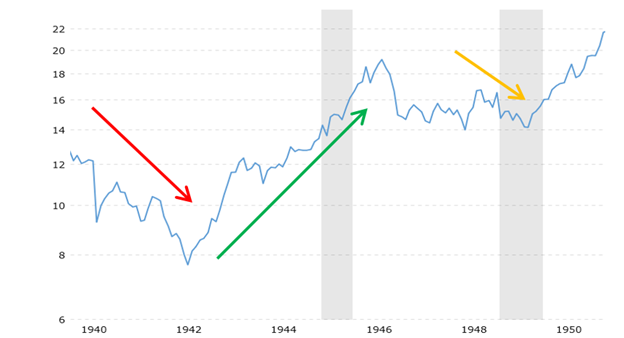
In the initial years, as reality sunk in that the US would enter the War, the market declined steeply. Following this, despite the country’s participation in the War, the market reacted favourably, in part due to government deficit spending bolstering the economy. With the War winding down, the Fed began to tighten rates, and the market declined, but to a lesser degree than it had with the onset of the crisis.
2020’s
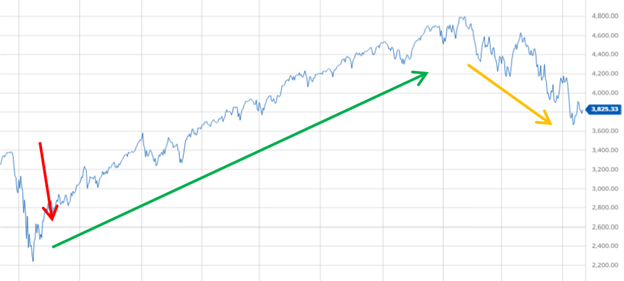
Although market reactions and movements have progressed more rapidly than in the 1940’s, thus far there appears to be a similar pattern emerging. The initial reaction to COVID-19 resulted in a steep decline of over 33%. This was followed by a strong advance in reaction to deficit spending. And, thus far, the negative dynamic in response to Fed tightening is less steep, declining approximately 23% from the January high to the recent 2022 low mark of mid-June.
Whether the markets will hold at this point and begin a new up-leg as was the case some 75 years ago is a question that only time can answer. Thankfully, it is not imperative that one gets the timing exactly right or is able to accurately forecast the markets’ future moves. A diversified portfolio that is in-line with investors’ time horizons and risk tolerance, together with the adept use of alternative asset classes and strategies, offers the greatest help for investors to weather the current inflationary environment we find ourselves in and must endure.
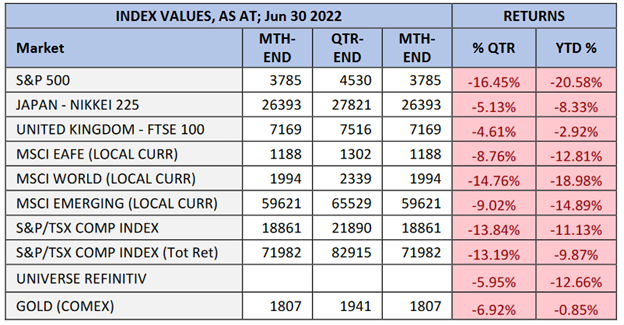
Markets endured their worst loss since the pandemic of March of 2020. All domestic and foreign markets saw losses. The US and Canadian markets recorded double digit losses, with the SP500 (US Market) crossing into official “Bear – Market” territory – a loss of 20% or greater. The tech heavy Nasdaq index, once the highflyer the previous years saw the biggest decline having almost lost 30%. With advancing interest rates investors were seeking the relative safety of proven cash-flow producing companies that paid dividends as opposed to the promise of future growth embodied in owning a technology stock still in growth mode.
The relative higher weighting in commodity and energy of the Canadian market provided a counter against the poor sentiment wrapped up in the pessimism that comes from inflation, economic slow down and war. Canada’s TSX Composite fell less than 10% year-to-date and 13.84% on the quarter as investors realized that a global slowdown would mean that energy prices and commodities used as inputs in manufacturing would experience weakness.
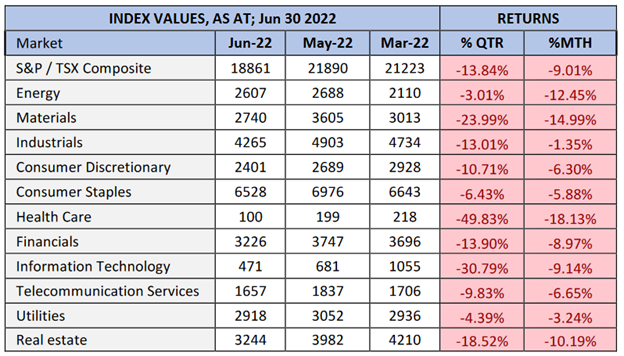
Fears of a global economic slowdown precipitated by worries of higher interest rates to combat inflation really started to sink in during June. Market sell-offs rivaled those of the pandemic as Energy and Materials companies experienced double digit losses of 12.5% and 15% respectively.
As is common in instances where fears of impending recession are pervasive, defensive companies tend to be the place where we find resilience. Utilities (like Enbridge), Telecommunications (like BCE) and Consumer Staples (like Loblaws, Metro, Alimentation Couche-Tard) all ended the second quarter higher than Dec 31st of last year – BCE with the help of the dividend had a positive 6months, negative without.
Lastly, bonds and gold also felt the pinch of higher interest rates and a higher US dollar. Steep interest rate hikes caused one of the worst bond sell-offs in a generation with mid-term bonds experiencing almost a 13.00% decline. Long-term bonds like those bundled into the US TLT ETF (iShares 20+ yr Treasury Bond) saw a 15.7% decline in value.
Our portfolios remained resilient against the selling pressure that saw every asset class (Income, Equity and Alternatives) exhibit losses. Our returns as a result were indeed negative, however, relative to the market our portfolios hedged out anywhere between 39% to 66% of the losses.
Our focus was to hold cash wherever possible and wait to see attractive pricing in asset classes before moving back into the markets. On average our portfolios held anywhere between 10% – 15% in cash (depending on risk and type of portfolio, some portfolios may have held more or less).
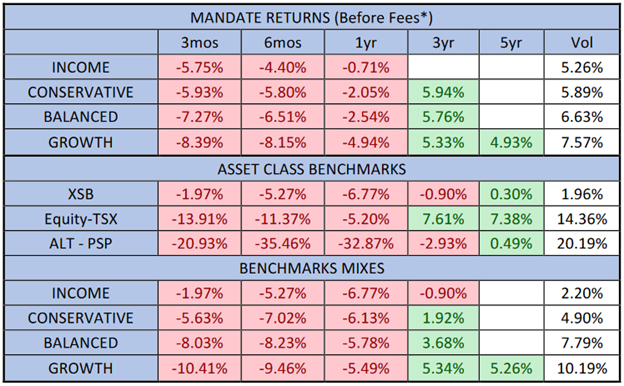
*Returns are before fees; with fees you may have experienced a small loss in the quarter.
On a yearly and 6-month basis all our portfolios achieved better returns than our TSX / XSB benchmark mixes. We’ve included the PSP ETF (Invesco Global Listed Private Equity) as a proxy for the Alternative asset class so that you can also compare how a basket of Alternative asset class managers and companies also fared against our portfolios.
Should you have any questions related to our services, your account, or this commentary, please do not hesitate to contact your Portfolio Managers Mark Taucar (905)-715-2260 or John Lombard (905)-484-3482.
This communication is intended for information purposes only and does not constitute an offer to sell or a solicitation to buy securities. No securities regulatory authority or regulator has reviewed or assessed the merits of the information provided. This communication is not intended to assist you in making any investment decision regarding the purchase of securities. Rather, Accilent Capital has prepared relevant documents for delivery to prospective investors that describe certain terms, conditions and risks of investment and certain rights that you may have. You should review all relevant documents with your professional adviser(s) before making any investment decision.
This report may have forward looking statements. Forward looking statements are not guarantees of future performance as actual events.
While every effort has been made to ensure the correctness of the tables, graphs – all data. Accilent Capital does not warrant the correctness, completeness or accuracy of financial data in this publication.